Utilizziamo i cookie per rendere migliore la tua esperienza di navigazione. Per rispettare la nuova direttiva sulla privacy, è necessario chiedere il tuo consenso per impostare i cookie. Per saperne di più.


SEGGER's J-Trace PRO can capture complete traces over long periods — thereby enabling the recording of infrequent, hard-to-reproduce bugs. This is particularly helpful when the program flow ‘runs off the rails’ and stops in a fault state.
It also supports extended trace features, such as Live Code Coverage (so engineers have visibility over which parts of the application code have been executed) and Live Code Profiling (providing visibility as to which instructions have been executed and how often, so hotspots can be addressed and optimization opportunities identified).
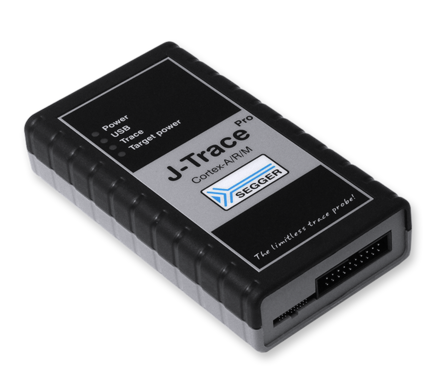
The J-Trace PRO Cortex-A/R/M provides support for Cortex-A/R/M-based microcontrollers. The SuperSpeed USB 3.0 interface of J-Trace PRO enables continuous streaming trace via USB with the full trace clock. Streaming in real time allows for data capture over long periods of time because there is no limit set on the amount of trace data. This gives you all the insight you need to develop and optimize your code.
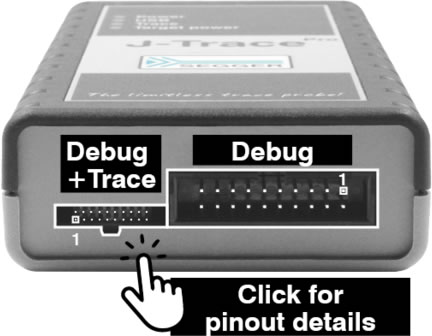
Debug and trace connectors
J-Trace has two connectors. The pinout of the debug and trace connector is in the SEGGER knowledge base. The debug connector is for debug only and can be used with target adapters for J-Link.
Please note, that only one connector can be used at a time!
Multi-platform
As a multi-platform solution, J-Trace PRO Cortex-A/R/M comes with the setup and control software for Linux, macOS and Windows. Software and firmware updates are included. Similarly, use on all currently supported target devices, and any that will be added, is also included.
J-Flash
J-Flash is a part of the J-Link Software and Documentation package and allows the programming of the internal and external flash memory of a microcontroller-based embedded system via J-Trace.
Speed
Up to 4 MB/s download speed make J-Trace PRO the fastest trace probe on the market.Flash Breakpoints
The J-Trace PRO Cortex-A/R/M comes with an additional feature, called Unlimited Flash Breakpoints, which allows the user to set an unlimited number of breakpoints when debugging in flash memory.
Ozone — The multi-platform debugger and performance analyzer
Ozone is a full-featured graphical debugger for embedded applications. It includes all well-known debug controls and information windows, and enables the best performance of J-Link debug probes and J-Trace trace probes. With Ozone it is possible to debug any embedded application on C/C++ source and assembly level. The Ozone Trace Tutorial allows developers to test the streaming and live analysis features of J-Trace PRO.
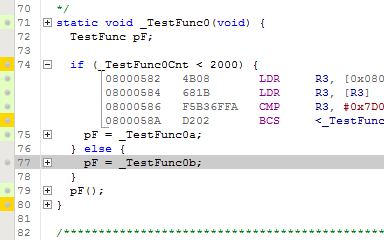
Instruction tracing
With streaming trace data users get deep insights into any application running on the target device whilst offering additional, powerful debug strategies to apply. It enables a far-reaching, yet complete, analysis of such issues, offering fast and efficient data analysis, ensuring higher productivity and also lowering development risks and costs.
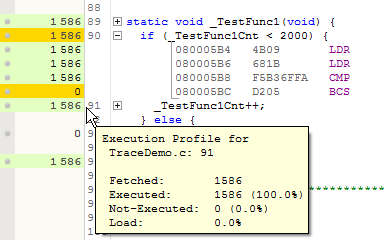
Live Code Profiling
Code profiling details which instructions have been executed and how often. Users can address application runtime hotspots and identify opportunities to optimize them. It is all about measuring the execution time and frequency of functions, blocks and instructions and highlighting where computing time is spent. These profiles can later be exported using a tool like the Ozone debugger, for documentation and analysis purposes.
Live Code Coverage
Through Live Code Coverage, engineers gain fully accurate information about how much of a source line, block, function, or file has been executed on a target application. It is this information that makes it possible to detect code that hasn’t been covered by tests — even code that may be unreachable. This enables a fast and efficient way to improve the code or to create a suitable test suite for uncovered blocks.
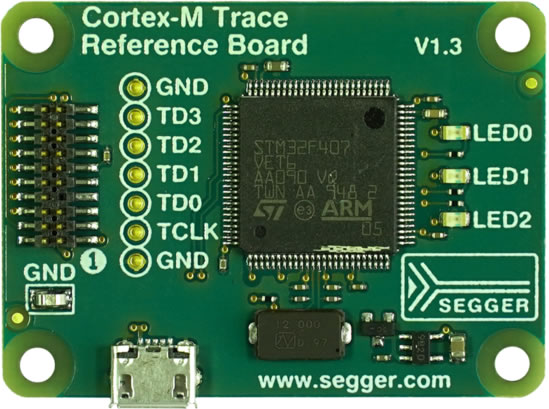
Trace reference boards
Trace reference boards are optimal for simple and portable trace demos. These boards allow testing and verification of trace setups within minutes. They can also be used as a reference for custom hardware projects as the trace reference boards are optimized for best trace signal quality.
All trace reference boards come with an example project that runs out-of-the-box. For easy setup the boards can be powered using a J-Trace PRO V2 or later.
Comparison
| J-Trace PRO Cortex-A/R/M | J-Trace PRO Cortex-M | J-Trace PRO RISC-V | |||||||
|---|---|---|---|---|---|---|---|---|---|
| Hardware features | |||||||||
| Power supply | USB | USB | USB | ||||||
| Download speed into RAM [1] | 4.0 MB/s | 4.0 MB/s | 4.0 MB/s | ||||||
| Max. CPU frequency | Unlimited | Unlimited | Unlimited | ||||||
| Max. TPIU frequency | 300 MHz | 300 MHz | 300 MHz | ||||||
| Max. trace clock frequency | 150 MHz | 150 MHz | 150 MHz | ||||||
| Max. SWO speed | 100 MHz | 100 MHz | 100 MHz | ||||||
| Max. target interface speed | 50 MHz | 50 MHz | 50 MHz | ||||||
| Host interfaces | |||||||||
| Ethernet | V | V | V | ||||||
| USB | V | V | V | ||||||
| Target interfaces | |||||||||
| cJTAG | V | V | V | ||||||
| JTAG | V | V | V | ||||||
| Arm SWD | V | V | X | ||||||
| Arm SWO | V | V | X | ||||||
| RISC-V SWD | X | X | V | ||||||
| Trace interfaces | |||||||||
| Buffer Trace | V | V | V | ||||||
| Cortex-M ETM Trace | V | V | X | ||||||
| Cortex-A ETM Trace | V | X | X | ||||||
| Cortex-R ETM Trace | V | X | X | ||||||
| Cortex-A PTM Trace | V | X | X | ||||||
| SiFive Nexus Trace BTM | X | X | V | ||||||
| Unlimited streaming trace + Live analysis [2] | V | V | V | ||||||
| Software features | |||||||||
| Flash Download | V | V | V | ||||||
| GDB Server | V | V | V | ||||||
| J-Flash | V | V | V | ||||||
| J-Flash SPI | V | V | V | ||||||
| Ozone | V | V | V | ||||||
| RDDI | V | V | V | ||||||
| RDI | V | V | V | ||||||
| Real-Time Transfer (RTT) | V | V | V | ||||||
| Unlimited Flash Breakpoints | V | V | V | ||||||
| Supported cores | |||||||||
| Cortex-A5 | D T | X | X | ||||||
| Cortex-A7 | D T | X | X | ||||||
| Cortex-A8 | D T | X | X | ||||||
| Cortex-A9 | D T | X | X | ||||||
| Cortex-A12 | D T | X | X | ||||||
| Cortex-A15 | D T | X | X | ||||||
| Cortex-A17 | D T | X | X | ||||||
| Cortex-A53 | D | X | X | ||||||
| Cortex-A72 | D | X | X | ||||||
| Cortex-M0 | D | D | X | ||||||
| Cortex-M0+ | D | D | X | ||||||
| Cortex-M1 | D | D | X | ||||||
| Cortex-M3 | D T | DT | X | ||||||
| Cortex-M4 | D T | DT | X | ||||||
| Cortex-M7 | D T | DT | X | ||||||
| Cortex-M23 | D | D | X | ||||||
| Cortex-M33 | D T | DT | X | ||||||
| Cortex-R4 | D T | X | X | ||||||
| Cortex-R5 | D T | X | X | ||||||
| Cortex-R8 | D T | X | X | ||||||
| E20 | X | X | D T | ||||||
| E21 | X | X | D T | ||||||
| E24 | X | X | D T | ||||||
| E31 | X | X | D T | ||||||
| E34 | X | X | D T | ||||||
| E61 | X | X | D T | ||||||
| E61-MC | X | X | D T | ||||||
| E76 | X | X | D T | ||||||
| E76-MC | X | X | D T | ||||||
| SC000 (M0 secure) | D | D | X | ||||||
| SC300 (M3 secure) | DT | DT | X | ||||||
V - Supported D - Debug support: Run control, memory access, etc. T - Pin trace supported X - Not supported
[1] The download speeds listed here are the peak download speeds that can be achieved by the particular J-Trace model. The actual download speed may be lower as it depends on various factors, such as, but not limited to: The selected debug interface & speed, the CPU core and its operating frequency, other devices in the JTAG chain in case JTAG is used as target interface.
[2] Unlimited streaming trace allows to transmit trace in real time to the PC. While traditional trace only allows to see and analyze the last xxx MB of trace data, with streaming trace it is possible to have all data available. This allows extended debugging features, such as code coverage or CPU load analysis based on a function basis.
- Streaming trace probe with SuperSpeed USB3.0 interface and Gigabit Ethernet
- Download speed up to 4 MB/s
- Unlimited breakpoints in flash memory (Flash Breakpoints)
- Use with Ozone and J-Flash
- Real-time streaming at full System Clock
- Fine-tune applications with Live Code Profiling
- Instruction-level code coverage to satisfy regulatory requirements
- Unlimited trace to isolate & identify hidden code defects
- Supports Cortex-A/R/M targets
- Full J-Link debug functionality
| Specification | Value | |||||||
|---|---|---|---|---|---|---|---|---|
| Supported OS | Microsoft Windows (x86/x64), Linux (x86/x64/Arm), macOS (x86/Apple M1) | |||||||
| Electromagnetic compatibility (EMC) | EN 55022, EN 55024 | |||||||
| Operating temperature | +5°C ... +60°C | |||||||
| Storage temperature | -20°C ... +65 °C | |||||||
| Relative humidity (non-condensing) | Max. 90% rH | |||||||
| Mechanical | ||||||||
| Size (without cables) | 123mm x 68mm x 30mm | |||||||
| Weight (without cables) | (without cables) 120g | |||||||
| Available interfaces | ||||||||
| Ethernet interface | Gigabit | |||||||
| USB interface | USB 3.0, SuperSpeed | |||||||
| Target interface | JTAG/SWD 20-pin (14-pin adapter available) JTAG/SWD + Trace 19-pin | |||||||
| JTAG/SWD interface, electrical | ||||||||
| Power supply | USB-powered (max. 400mA) | |||||||
| Target interface voltage (VIF) | 1.2V ... 5V | |||||||
| LOW level input voltage (VIL) | VIL <= 40% of VIF | |||||||
| HIGH level input voltage (VIH) | VIH >= 60% of VIF | |||||||
| JTAG/SWD interface, timing | ||||||||
| Data input rise time (Trdi) | Max. 20ns | |||||||
| Data input fall time (Tfdi) | Max. 20ns | |||||||
| Data output rise time (Trdo) | Max. 10ns | |||||||
| Data output fall time (Tfdo) | Max. 10ns | |||||||
| Clock rise time (Trc) | Max. 10ns | |||||||
| Clock fall time (Tfc) | Max. 10ns | |||||||
| Trace interface, electrical | ||||||||
| Power supply | USB-powered (max. 400mA) | |||||||
| Target interface voltage (VIF) | 1.2V ... 5V | |||||||
| Voltage interface low pulse (VIL) | Max. 40% of VIF | |||||||
| Voltage interface high pulse (VIH) | Min. 60% of VIF | |||||||
| Trace interface | ||||||||
| Max. trace clock frequency | 150 MHz | |||||||
Tecnologix offre supporto gestito direttamente dal Team di sviluppo.
Non esitare a metterti in contatto con i nostri esperti.
Basta chiedere qui
Non esitare a metterti in contatto con i nostri esperti.
Basta chiedere qui
Abbiamo trovato altri prodotti che ti potrebbero interessare!