Utilizziamo i cookie per rendere migliore la tua esperienza di navigazione. Per rispettare la nuova direttiva sulla privacy, è necessario chiedere il tuo consenso per impostare i cookie. Per saperne di più.
All-in-one solution
Ozone supports ARM-based and RISC-V microprocessors. With J-Link tightly integrated, all devices supported by J-Link can be used with Ozone.
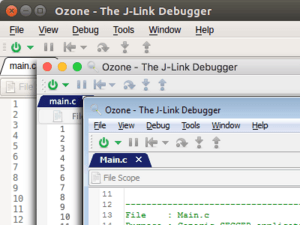
Ozone is available on Windows, macOS, and Linux. Similar look and feel on all platforms and fully portable projects enable efficient development on the operating system of your choice.
Ozone can be used with output of any tool chain / IDE. Freely select the build system that best suits your project and always benefit from Ozone's debugging capabilities. Write your code in C or C++, Ozone visualises your application sources and symbolic information.
Standalone debugger
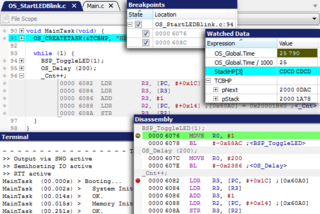 Ozone focuses on debugging. No compiler or project window will distract your work, All debug windows can be moved, resized and docked, to provide you with the workspace you need.
Ozone offers all well-known debug controls and information windows, and a bit more. Instruction trace, power graph, live watches, and real-time terminal I/O further extend these capabilities.
With the source editor you can fix bugs immediately on detection.
The performance analyzer
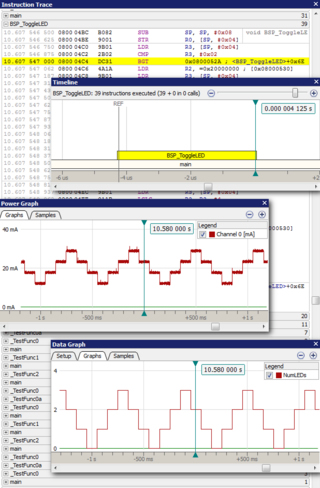 Ozone features more than plain debugging. With the extensive features of J-Link and J-Trace it can be used for a full performance analysis of your target system.
In combination with J-Trace, Ozone can record and analyse the run-time of your application. The executed instructions are displayed to step back and see what your system did last, and can be visualised in a timeline to easily see the function and interrupt call path. Additionally the execution is analysed to provide a complete code coverage and profiling analysis.
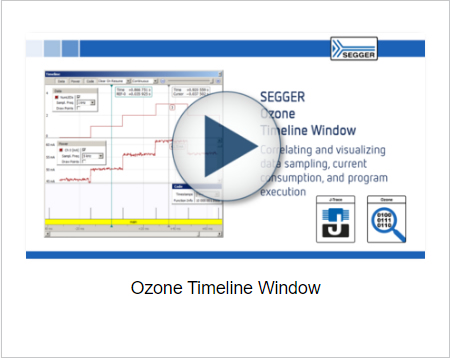
With J-Link's High-Speed Sampling technology, Ozone can sample and visualise your system's variables over time. Easily check values and flags in the debugger, while the target keeps running.
J-Link's power measurement features enable you to record the power consumption of your target device in a debug session. This is especially helpful when you develop a low-power device and need to know how power consumption changes when you enable or disable certain components.
All performance analysis windows can be synchronised to get the link between them. You want to know why your error flag was set? Check the Data Graph and Instruction Trace windows. You want to see what happens when you turn on the display? Have a look at the Timeline and Power Graph.
Get system insight
Ozone does not only analyse the run-time performance. You can also get detailed information about the current state of your system when it is halted.
With its RTOS awareness Ozone provides you with information about the OS of your application - In which task did the system halt? What are other tasks currently doing? How much stack does each task use? Ozone comes with RTOS awareness plugins for embOS and FreeRTOS. A plugin SDK is available for you to add awareness for your OS.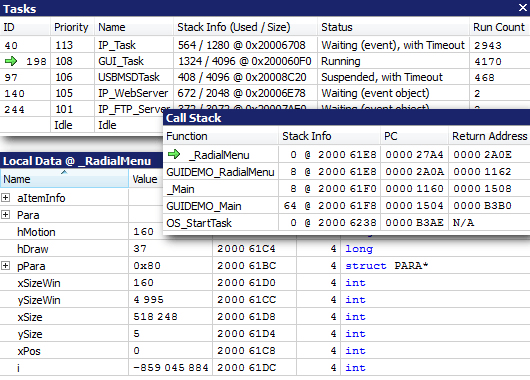
Automate your setup & tests
 Ozone projects feature a C-like scripting language that allow you to configure the graphical user interface and to automate the debugging work flow. Most actions that are accessible withe the GUI have an affiliated script function that can be evoked from your project script or manually from the debuggers console window.
In a project file you can use various event handlers to perform your actions on certain events, such as on debug start, before download, after reset, or on halt and go. You can also add event handlers to your breakpoints. With this functionality you can set up your project to set up the whole debug session for a consistent configuration, and even run automated tests without requiring any user interaction.
When starting Ozone for the first time, the New Project Wizard will guide through the setup of the first project. Set your target device and the J-Link connection settings. Now select your application data file, which is usually the output (elf) file from your tool chain or IDE. Your first project is ready to run a debug session. You can save your project for further load and modify it, as it is a simple C-like script.
Getting Started: First Run & Project Generation
When starting Ozone again, a welcome dialog pops up, to open a recent project, or create a new one.

Debugging with Ozone
Debugging with Ozone can be controlled through the most common keyboard shortcuts or buttons from the toolbars, to be used intuitively.
To start debugging, a J-Link and the target have to be connected to the PC. Ozone can download the application code to the target, if there is a file selected.
A debug session is started with F5 or the green On/Off button from the toolbar.
After starting, the code is downloaded and the application is reset and runs to main(). The reset behavior can be changed via the System Variables.
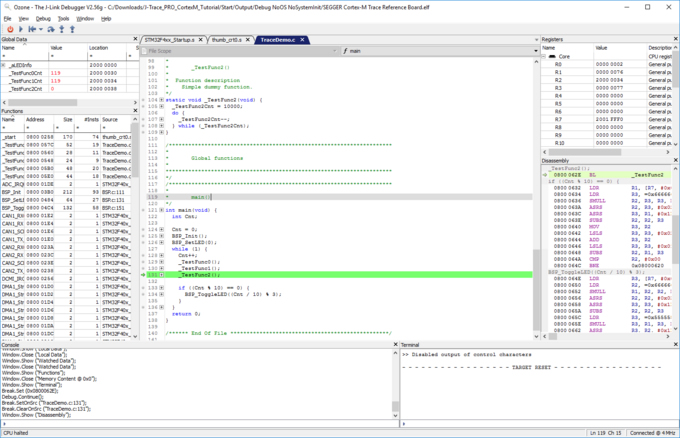
Ozone features the most usable debug information windows to give full overview and control over the target application. The Source Viewer highlights the current line of execution and gives information about the application. The instructions to be executed can also be shown in the Disassembly. Ozone allows stepping on source level, as well as on instruction level. The Memory, Global, Local and Watched Data and the Registers Windows show information about the current state and content of the target. The data can also be written and changed from any of these windows.
Ozone includes a Terminal which allows communication with the target in the most common ways. It can display SWO data, handle semihosting commands and show output and send input with SEGGER's Real Time Transfer (RTT) technology.
Licensing
Commercial use
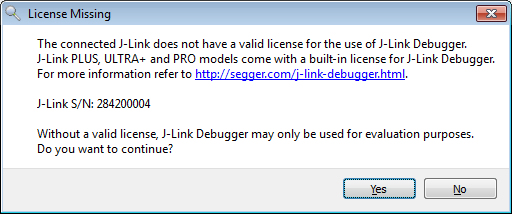 Ozone can be used in a commercial environment as part of the licence for J-Link PLUS, ULTRA+, PRO and J-Trace. With J-Link BASE, Ozone can be used commercially after purchasing the J-Link BASE to PLUS upgrade bundle, that includes the Ozone license. With other J-Link models, Ozone remains in evaluation mode and presents the following screen each time a debug session is started.
Free for non-commercial use
Like most of our software, Ozone can easily be downloaded and installed without any registration process.
For non-commercial use or evaluation, Ozone is available to be used free of charge.
With a J-Link PLUS, PRO, ULTRA+, or with a J-Trace, Ozone is available for free.
- Stand-alone graphical debugger
- Debug output of any tool chain and IDE1
- C/C++ source level debugging and assembly instruction debugging
- Debug information windows for any purpose: disassembly, memory, globals and locals, (live) watches, CPU and peripheral registers
- Source editor to fix bugs immediately
- High-speed programming of the application into the target
- Direct use of J-Link built-in features (Unlimited Flash Breakpoints, Flash Download, Real Time Terminal, Instruction Trace)
- Scriptable project files to set up everything automatically
- New project wizard to ease the basic configuration of new projects
1 Ozone has been tested with the output of the following compilers: GCC, Clang, SEGGER, ARM, IAR. Output of other compilers may be supported but is not guaranteed to be.
Non esitare a metterti in contatto con i nostri esperti.
Basta chiedere qui


