Utilizziamo i cookie per rendere migliore la tua esperienza di navigazione. Per rispettare la nuova direttiva sulla privacy, è necessario chiedere il tuo consenso per impostare i cookie. Per saperne di più.


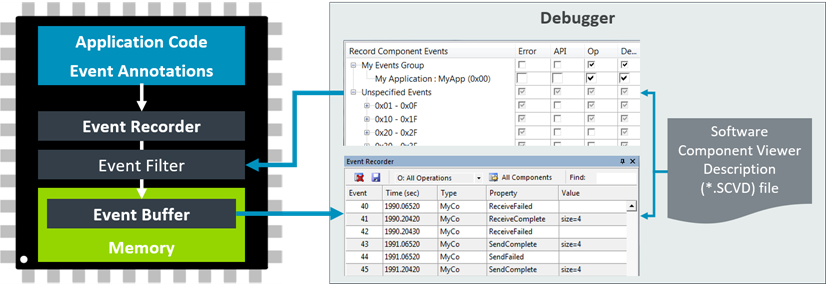
Event Recorder provides an API (function calls) for event annotations in the application code. These functions record events along with timestamps and additional information. The data is stored in the event buffer located in the RAM of the target hardware.
The µVision debugger reads the content of the event buffer and displays it in the Event Recorderwindow. The graphical display over time is available in the System Analyzer window. Other timing and power data can be observed in the Event Statistics window.
BENEFITS
- Visibility to the dynamic execution of an application at little (memory) cost.
- Adding RTOS awareness to a development tool does not require complex DLL programming.
- For Arm Cortex-M3/M4/M7/M33 processor based devices, Event Recorder functions will not disable interrupts.
- Adding printf re-targeting for devices without ITM, such as Arm Cortex-M0/M0+/M23.
- Fast time-deterministic execution of event recorder functions with minimal code and timing overhead.
- No need for a debug or release build as the event annotations can remain in production code.
- Saving the event data in local memory ensures fast recording.
- Collecting the data from the on-chip memory is done using simple read commands. These commands work on all Cortex-M processor based devices and require only JTAG or SWD connectivity to the debug adapter.
- Using the DWT Cycle Count register for creating time stamps reduces code overhead (available on Arm Cortex-M3/M4/M7/M33).
EVENT RECORDER WEBINARS
 | Dynamic software analysis with MDK Event Recorder Today, flexible and easy-to-use software components are essential for microcontroller applications. These software components are frequently a "black box" to the application programmer, which makes the analysis of potential issues challenging. This webinar recording introduces the Event Recorder and explain how it enables programmers understand and analyze the operation of software components. | |
 | Using the Event Recorder to identify timing and power consumption bottlenecks Understanding the dynamic operation of an embedded application during development is required to identify any potential timing and power consumption issues. Software components within Arm Keil MDK, such as the RTX real-time operating system, contain event annotations that help you to understand how an application operates during the development process. These events are shown in the Event Recorder. In this webinar, you will learn how to annotate your application code with events that provide detailed statistics about execution timing and energy consumption. This information allows you to optimize algorithms and compare changes, for example in automated build tests. |